
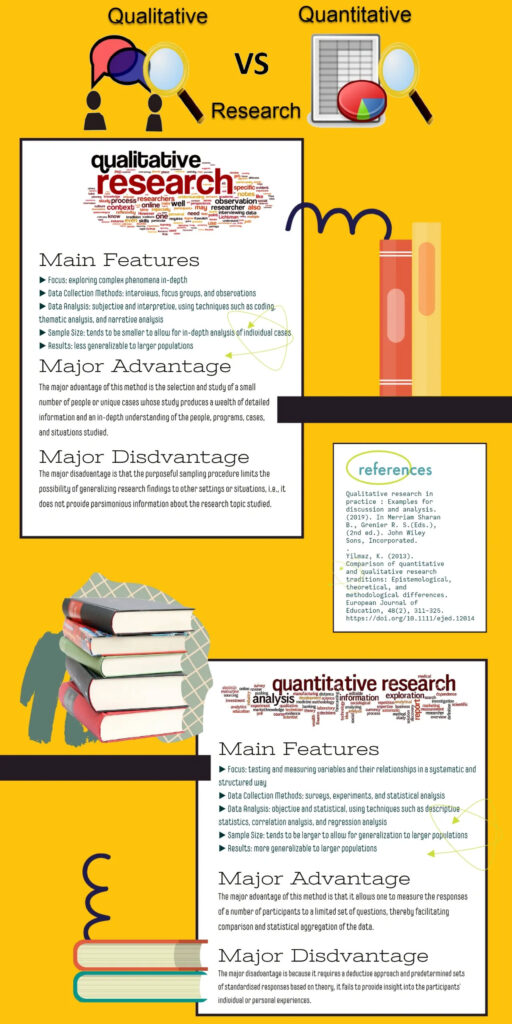
The Module 1 written assignment required us to use the infographic platform of our choice to create an infographic comparing qualitative research with quantitative research. We were to clearly indicate the strengths and weaknesses of each methodology as well as the rationale for why a researcher may select each approach.
We were asked to use our course readings as a resource when developing our infographic. APA citations were required throughout the infographic, and APA references were to be included at the bottom of our infographic.
Assignment Grade: 75/75